
572
June 8, 2015
In my commentaries over
the last number of years, I have discussed the impact of global central
bank policies on both the economy as well as the financial markets.
That has been the primary driver of the movement in asset prices
and will continue to be for some time.
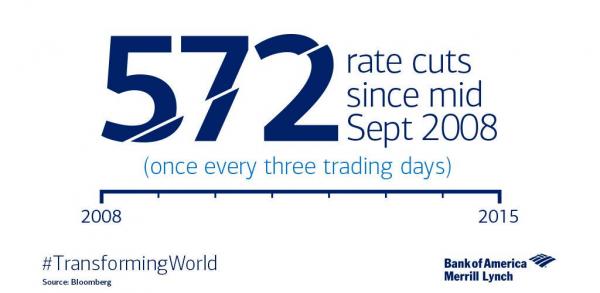
Central banks around the world have been cutting interest rates
for eight years and collectively have printed over $11 trillion of new
money to try to revive economic growth.
This graphic by Bank of America helps to put the magnitude of one
side of monetary policy into perspective.
As the central banks
have reduced returns on low risk assets with the most aggressive
monetary policy in history, money has moved increasingly into riskier
assets in search of some return.
As money chases returns in riskier and riskier assets classes,
the yields as well as future prospective returns on those assets go
lower and lower.
The central banks
should not have entered this game of extreme monetary policy because the
deeper they go into this abyss the harder it gets to escape back out.
Targeting asset price inflation to garner a wealth effect; then
turning to currencies to gain a competitive trade advantage, and
continuing to encourage the massive growth of debt creates all kinds of
distortions in the economy and financial markets.
It has also muted asset price volatility which has given
investors a false sense of stability and has pushed complacency to
greater and greater extremes.
SIGNS OF VOLATILITY…
However, over the past
7 months or so, volatility is starting to emerge in a number of areas of
the financial markets. If
this continues to grow and spread to other areas of the market, things
may get interesting for the central banks.
So far, volatility has been increasing in the currency markets,
commodity markets and more recently the bond markets.
We can look at the recent movement in the yield of the 10-year
German Bund. This is an
equivalent of our 10-year Treasury Bond.
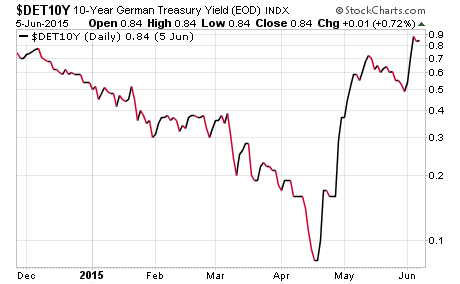
If you look at the
first 2/3rds of the chart above, you can see that the yield on the
10-year German Bund had been declining due to interest rate cuts in the
EU as well as all the new money printed by the European Central Bank.
At the lows in April, you could lock up your money for 10-years
in German government bonds at an annualized yield of 0.06%.
That means that if you put $10,000 into those bonds and held them
to maturity, you would receive a total of $60 in interest by the end of
the 10-year period, or $6 per year!
Now, look at the end of
the chart and you can see a massive reversal.
While the yield is still very low it has jumped by 14 times, or a
1400% change. This kind of
volatility change looks more like an extreme move in a small emerging
market country, not something that comes from one of the most mature
bond markets in the global financial system.
Next, let’s take a look
at 10-year Treasury Bond yields.
While the volatility is much less than the German market, the
yields here are moving in the same direction.
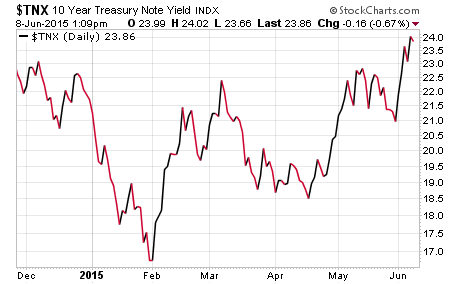
The chart above shows
that the yield on the U.S. 10-year Treasury Bond has moved from about
1.65% at the end of January to about 2.4% recently.
As all of the yields
around the world collapsed in so many areas of the market, investors
have moved into stocks to try to get some return on their money.
If interest rates on “safe” assets like government bonds continue
to rise and the Fed starts to raise short-term rates, investors may
start the process of reversing this “relative return” trade that has
been in process over the life of the 572 rate cuts by central banks
since 2008.
SAME TUNE…
This month, we can keep
the discussion relatively short.
It’s the same old game:
-
Debate continues as to whether the Fed will or
won’t raise rates this year.
-
Corporations continue to issue debt to buy back
stock to engineer earnings per share growth since there is little top
line revenue growth.
-
Margin debt continues to expand and now is up to
$507 billion which is 50% higher than the last bubble peak in 2007.
-
Capital spending by corporations and
productivity continues to be anemic as CEO’s remain cautious about
committing capital to longer-term projects.
-
Etc………
A FEW SIGNS TO MONITOR…
The key dynamic to
watch right now is in the bond market.
If the recent volatility continues we will likely get some
interesting price movements in other markets over the summer months.
One final note.
The Dow Jones Industrial Average just went negative for the year
and the Transportation Average is down over 8% for the year.
The idea behind tracking these two is that many of the companies
in the Dow Index produce products while the companies in the
Transportation Index deliver those products to the customers.
One sign of a healthy market is when these two indices are
trending higher with the Transports leading the way.
Lately, both have started to roll over somewhat with the
Transports leading on the downside.
Also, a number of the market breadth indicators have been
weakening.
All the liquidity
coming from the central bankers have been the juice for this market for
a long, long time. 572…
that’s a whole lot of rate cuts… that the world has never seen… an
average of one every three trading days…
Wow! That means a
whole lot of rate increases by global central banks to get back to
normalized monetary policy and our Fed can’t even take the first baby
step of 25 basis points out of fear of what it may do to our economy and
asset prices. Seems like a
fragile foundation underneath sky high asset prices to me.
Joseph R. Gregory, Jr.