
WHEN A BEAUTIFUL DELEVERAGING TURNS UGLY
Special Report
September 30, 2015
It is necessary to
understand how the economy works in order to develop a perspective on
the financial markets both in the short-run as well as the long-term.
Ray Dalio, one of the best macro thinkers of our generation and
founder of Bridgewater, the largest hedge fund in the world, has created
a framework to explain the dynamics of an economy.
In this discussion, I
am going to use Dalio’s framework of the economy to offer a perspective
on how we may be at one of the most significant junctures in the last 85
years as it relates to the global economy and implications for the
financial markets. In order
for this perspective to make sense, you first need to understand Dalio’s
framework. He has created a
short, thirty minute video which is a good depiction of how the economy
functions. Instead of
explaining it here, it is much more effective for you to do a Google
search for “How The Economic Machine Works” by Ray Dalio and watch the
video yourself. The video
can be seen at
www.economicprinciples.org or you can also search for it on YouTube.
So, I encourage you to stop reading, watch the video and then
return to this discussion.
Now that you have seen
Dalio’s video, let’s use that framework to think through a possible
scenario that may unfold in the economy and the financial markets.
To do this, I will first review a few key dynamics from the
video. Then, I will use his
framework to offer a perspective on the current situation and a scenario
that may be on the verge of unfolding.
In addition, I will put that scenario within the context of the
global environment. At the
end, I will provide a few concluding remarks.
Let’s get started.
POINTS OF EMPHASIS REGARDING
“THE ECONOMIC MACHINE”…
In Dalio’s description
of The Economic Machine, productivity drives the long-term trend in
economic growth by the participants working either harder or smarter.
Then, credit cycles either accelerate growth by pulling demand
forward during credit expansions or slow down growth when credit
contracts and repayments increase.
These credit cycles cause economic growth to oscillate above and
below the longer-term trend.
Also, there is a short-term credit cycle that last usually
between 5 and 8 years and a long-term credit cycle that typically occurs
over a 75 to 100 year period.
To provide a visual on
how the short-term and long-term debt cycles oscillate around the
productivity trend of fundamental growth, here is the chart Dalio used
in his video.
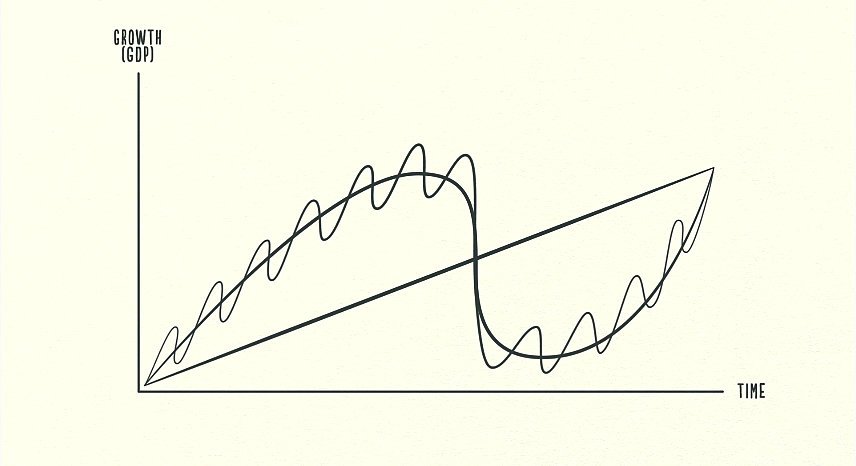
In the chart above, the
straight line going higher over time is the productivity line which
drives long-term economic growth.
The larger wave is the long-term debt cycle and the smaller wave
reflects the short-term credit cycle.
The short-term cycles trend higher as human nature drives
consumption levels higher than income levels until an economy reaches an
unsustainable amount of debt accumulation.
The long-term cycle begins at low levels of debt in the economy
and ends at very high levels of debt.
And, the process of returning from the peak in the long-term
cycle back to low amounts of debt is called a deleveraging.
During these credit
cycles, the central bank plays an active role as we have all seen.
In the short-term cycle, the central bank uses interest rates to
influence either the acceleration or deceleration of credit growth.
When credit growth is accelerating quickly and inflation concerns
begin to surface, the central bank raises rates to make the cost of
credit more expensive so as to temper growth.
On the other side, when credit growth is slowing or contracting
during a recession, the central bank lowers rates to make credit less
expensive to try to increase spending and reignite growth.
This goes on for decades until an economy is saturated in debt.
Then, there is a
tipping point where a deleveraging occurs and even though the central
bank lowers rates, it has little effect because participants in the
economy cannot or will not take on new debt regardless of how cheap it
is. The long-term credit
expansion is a self-reinforcing cycle of growth and a deleveraging feeds
off itself as well but in a downward cycle.
Often, central banks are at or near zero interest rates during
deleveragings.
During deleveragings
people cut their spending, debt is reduced through defaults and
restructurings, wealth is redistributed through tax policies and the
central bank prints money.
While inflation is the primary concern of central banks during the
long-term credit expansion part of the cycle, fears shift to deflation
in the deleveraging period of the cycle.
With this in mind, let’s now shift to putting the current
environment within the context of Dalio’s Economic Machine framework.
SO, WHERE ARE WE NOW???
Debt cycles are a key
driver of the overall machine so let’s begin by taking a look at debt
levels as a percent of GDP over the last 100 years.
Here is a chart from Gamco Mathers Fund.

If you look at the
chart above, you can see the prior peak in the long-term debt cycle in
the 1930’s and the subsequent deleveraging.
The debt levels were reduced back to a low level which then reset
the economic foundation for the next long-term cycle of debt
accumulation. Now, if you
look at the end of the chart, you see potentially another peak which was
around 2007, and happens to be about 75 years from the last peak.
After the recent peak,
we saw the first wave of deleveraging in 2008 and 2009.
And, what have we seen from the central bank; move to the zero
bound in interest rates and the printing of over $4 trillion in new
money [the chart embedded at the top center above puts how much money we
have printed into context].
The last time we saw anything close to these extreme monetary policies
was in the Great Depression.
These are not policies found during the uptrend period of the
long-term debt cycle.
AN EMERGING SCENARIO…
Now, here is where it
gets even more interesting and these are my interpretations and I have
not heard Dalio’s perspective on this.
So, as Dalio describes, the short-term credit cycle oscillates
around the long-term debt cycle trend, as shown in the first chart
earlier. To dive deeper
into the current environment, let’s magnify the chart of both short and
long-term debt cycles of the recent period.

In the chart above, the
black line represents the long-term debt cycle and the red line
represents the short-term debt cycle.
So, here is the scenario.
The peak in both the short and long-term debt cycles occurred in
2007. Period # 1 above
shows that the short-term debt cycle accelerated downward at the same
time the long-term debt cycle began to roll over.
When the short-term and long-term cycles line up, you get
acceleration in the overall trend, both on the upside and on the
downside.
THE FIRST WAVE…
In this first wave
down, we had the Great Recession and a financial crisis which led to a
shift in monetary policies back to the Great Depression era with the
central bank cutting rates to zero and starting up the printing press as
fears of deflation surfaced.
Bernanke just happened to be the chair of the central bank and
his field of academic study was focused on the Great Depression; and he
pulled out the playbook.
During this wave #1 in the chart above, we also saw high profile
bailouts of failed institutions, increased government guarantees in
certain areas of the financial system, as well as significant debt
restructurings. These
dynamics are picture perfect for what is found in a deleveraging.
These extreme monetary
policies and government actions had the effect of slowing down the
deleveraging process and turning it back up, but at a slower ascent,
from 2009 through 2015, which is period # 2 above.
The initial descent and subsequent reprieve from the downward
deleveraging force of the long-term cycle has played out in the form of
another short-term credit cycle.
THE SECOND WAVE…
Over the past six years
or so since 2009, the short-term credit cycle turned back up in the
midst of the long-term cycle being down.
Instead of good economic growth, we have seen very muted growth
and one of the worst “recoveries” on record.
When the cycles are going against one-another in the long-term up
cycle, you get a mild to moderate recession and when the cycles are
going against one-another in the long-term down cycle, you get a mild
recovery. This mild
economic recovery occurred during period # 2 in the chart above.
This initial wave of
the deleveraging process was met by unprecedented monetary policies.
That has created this battle between the deflationary forces of
deleveraging and the inflationary forces of the monetary policies.
Dalio’s Economic Machine outlines what he calls a “Beautiful
Deleveraging” when the central bank finds the right balance of monetary
policy so that the deflationary pressures are balanced by the
inflationary policies. If
the balance is managed appropriately, it enables the economy to
deleverage and reset debt levels without too much pain or causing a
depression. Through periods
# 1 and # 2 above, it might appear based on this framework that the
deleveraging has been “beautiful” so far.
However, the
significant challenge is that if you look back up at the total debt
chart, you can see that the deleveraging of the long-term debt has only
begun here in the U.S. and there is a whole lot left to go.
And, to accomplish this “beautiful” deleveraging so far, the
central bank has already used much of its available ammunition.
Instead of allowing the
deleveraging to occur, our central bank has created a short-term
reflation of debt. That
implies that our central bank used too much force in the first wave down
instead of achieving the desired balance of monetary policy.
The deleveraging cycle will continue and the perceived benefits
of the monetary policies are subsiding.
Now, if we look at the
possibility that the short-term credit cycle is peaking once again in
the midst of the long-term cycle continuing downward, we could see
another serious economic contraction which would have significant
implications for financial markets as well as monetary policy.
By the way, the time between the ’07 peak and a ’15 peak in the
short-term cycle would be 8 years which fits the typical range for the
short-term cycle outlined by Dalio.
Before I discuss the
impact of the cycles converging again, let’s step back for a moment and
consider the global environment.
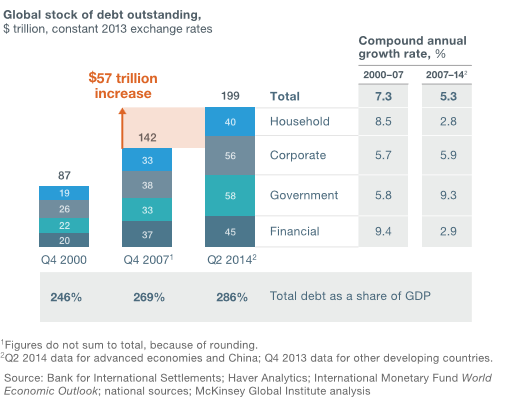
THE GLOBE IS AWASH IN DEBT…
Since the potential
recent peak in the long-term debt cycle here in the U.S. back in 2007,
global debt has continued to increase at an alarming rate.
McKinsey & Company, the leading global consulting firm, recently
published a study in February of this year called “Debt and (Not Much)
Deleveraging. I will quote
some of their findings here.
“Seven years after the
bursting of a global credit bubble resulted in the worst financial
crisis since the Great Depression, debt continues to grow.
In fact, rather than reducing indebtedness, or deleveraging, all
major economies today have higher levels of borrowing relative to GDP
than they did in 2007. Global
debt in these years has grown by $57 trillion, raising the ratio of debt
to GDP by 17 percentage points (Exhibit 1).
That poses new risks to
financial stability and may undermine global economic growth.”
“In our study, we
pinpoint three areas of emerging risk: the rise of government debt,
which in some countries has reached such high levels that new ways will
be needed to reduce it; the continued rise in household debt—and housing
prices—to new peaks in Northern Europe and some Asian countries; and the
quadrupling of China’s debt, fueled by real estate and shadow banking,
in just seven years.”
“Government debt is
unsustainably high in some countries.
Since 2007, government debt has grown by $25 trillion.
It will continue to rise in many countries, given current
economic fundamentals. Some
of this debt, incurred with the encouragement of world leaders to
finance bailouts and stimulus programs, stems from the crisis. Debt also
rose as a result of the recession and the weak recovery.
For six of the most highly indebted countries, starting the
process of deleveraging would require implausibly large increases in
real-GDP growth or extremely deep fiscal adjustments.
To reduce government debt, countries may need to consider new
approaches, such as more extensive asset sales, one-time taxes on
wealth, and more efficient debt-restructuring programs.”
“Household debt is
reaching new peaks. Only in
the core crisis countries—Ireland, Spain, the United Kingdom, and the
United States—have households deleveraged.
In many others, household debt-to-income ratios have continued to
rise. They exceed the peak
levels in the crisis countries before 2008 in some cases, including such
advanced economies as Australia, Canada, Denmark, Sweden, and the
Netherlands, as well as Malaysia, South Korea, and Thailand.”
“Fueled by real estate
and shadow banking, China’s total debt has nearly quadrupled, rising to
$28 trillion by mid-2014, from $7 trillion in 2007.
At 282 percent of GDP, China’s
debt as a share of GDP, while manageable, is larger than that of the
United States or Germany. Three
developments are potentially worrisome: half of all loans are linked,
directly or indirectly, to China’s overheated real-estate market;
unregulated shadow banking accounts for nearly half of new lending; and
the debt of many local governments is probably unsustainable.”
McKinsey’s study raises
questions about how much, if any, has the U.S. really deleveraged since
2007. Households have
deleveraged some but the government has added new debt.
Also, it is not unusual to see debt actually go up in the
government sector during the initial phases of a deleveraging as they
spend to try to maintain growth, while tax receipts fluctuate lower.
In summary, their study shows that the world is awash in debt.
Now, if we look at the
three largest developed economies as the U.S., Europe, and Japan it is
interesting to note what we have seen from a monetary policy standpoint.
Each is already at or near the zero bound in interest rate policy
and each has printed significant amounts of money over the past few
years. Some countries
within Europe have even gone the extra step of moving to negative rates.
These are deleveraging and Great Depression-type policy measures
which match up well with the scenario that the world economies are
either in or moving toward the deleveraging part of their long-term debt
cycles.
THE THIRD WAVE…
Next, let’s turn back
to the potential scenario that the short-term and long-term credit
cycles may be on the verge of lining up in the same direction here in
the U.S. once again. In the
earlier chart showing the long-term cycle with the black line and the
short-term cycle with the red line, this would mean that we are moving
toward the wave down in period # 3.
Then, the question
comes to whether our central bank used up too much of its ammunition in
the first wave down of the deleveraging cycle.
It is debatable what effects those policies have had on the real
economy but what we do know is that it has inflated asset prices back up
to very lofty levels from a valuation perspective.
It appears so far that the deflation pressures from the
beginnings of the deleveraging cycle have continued to manifest itself
in the real economy while the inflationary pushes from the monetary
policies have been reflected in the financial markets with the
levitation of asset prices.
If we are moving into
that third period on the chart, monetary policy is likely to go even
further out on the spectrum which would first include a new round of
money printing or, QE 4. Other
types of asset purchases will likely be included as the central bank
looks for more direct ways to push money into the system.
Also, negative interest rates would likely follow and we even had
one central bank member mention that possibility at the latest meeting.
Fiscal policy will look for new ways to get involved as well.
This period would include the next economic contraction and a
high probability that asset prices would reconnect to fundamentals.
Each incremental step in monetary policy over the past few years
has been shown to be less effective and when you are already at extremes
the perceived benefit will likely diminish even further.
If the central bank
used up too much ammunition in the first phase of the deleveraging and
the next frontier of monetary policy is perceived as being ineffective
at a time when the short and long-term cycles converge once again, that
is the point when the previous “beautiful” deleveraging turns ugly.
A SYCHRONOUS GLOBAL
DELEVERAGING…
Now, overlay what is
going on around the world and the potential for a global synchronous
deleveraging at a time when the world central banks are already at
extreme policies, the scenario turns even more interesting.
If we have the short-term credit cycles turn back down and
reconnect with the long-term debt deleveraging cycles around the globe
at the same time, the deflationary forces will be powerful relative to
any conceptual monetary strategy.
The implications for stocks, bonds, currencies, commodities and
other assets become tricky as all central banks would likely end up
printing the money required for the debts that do not end up in default
or restructured along the way.
How that money infiltrates into the economic system and financial
markets is something to think through as one positions around this
scenario. Social
implications will be notable as well.
Let’s conclude this
discussion. Ray Dalio’s
Economic Machine framework for understanding how the economy works is
one of the best depictions available.
Overlaying that framework on the U.S. and global economies with a
historical perspective, helps one to understand potential scenarios that
may unfold as this deleveraging process continues.
It is hard to imagine scenarios such as the one described here in
the midst of daily activities and the extreme short-term focus in the
financial markets by participants. However,
in 2007 most all did not imagine what would occur in the first phase of
the deleveraging during 2008 and the subsequent monetary policies that
followed. It is a time to
at least consider a scenario such as this since the implications are
significant and ensure you have a plan to position appropriately.
Joseph R. Gregory, Jr.